
On Forecasting USD/JPY
Two inflection points, both anticipated, and what the signals say now
USD/JPY experienced two major inflection points in late January: a –2.08% decline followed by a +3.14% recovery, both flagged in advance by our causal drivers' framework. This analysis shows a closer look at these forecast signals and where USD/JPY is likely to move over the coming 5–20 days.

January Forecast Signals and Realized Outcomes
Two key points in late January 2026 illustrate the behavior of USD/JPY relative to predicted moves. Importantly, these forecasts reflect the predicted movement of USD/JPY derived from its causal relationships between other assets. Each listed asset reflects a forward-looking prediction for USD/JPY over the specified horizon, rather than the asset’s own expected price move.
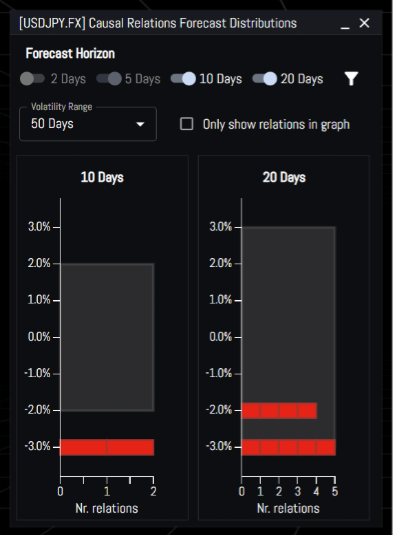
23 January 2026
Forecast horizon: 10 days
Ethereum USD: –2.91%
Forecast horizon: 20 days
E-mini Russell 2000: predicted –2.46%
DAX Performance Index: predicted –1.74%
Swiss Market Index PR: predicted –2.47%
30-Year TB Futures: predicted –2.41%
EUR/JPY: predicted –3.23%
Copper Futures: predicted –2.57%
Outcome:
USD/JPY declined 2.08% over the subsequent 10 days and 3.58% over the subsequent 20 days, directionally consistent with the forecasts issued at that time.
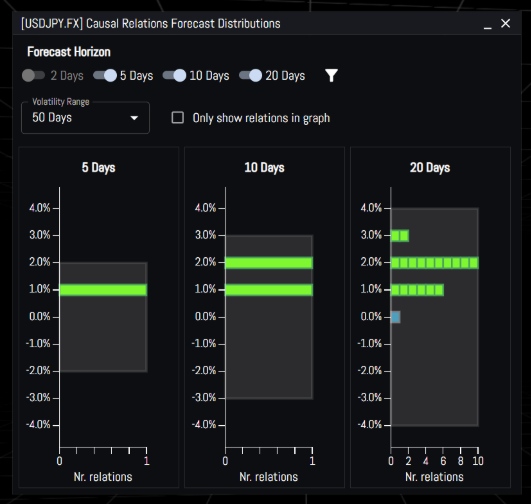
28 January 2026
Forecast horizon: 5–10 days
Health Care Select Sector SPDR Fund: predicted: +1.22% over 5 days
Industrial Select Sector SPDR Fund: +1.34% over 10 days
Forecast horizon: 20 days
USD/HUG: predicted +3.16%
IBOVESPA predicted: +3.47%
ICE Brent Crude Futures: predicted +1.50%
EUR/GPD: predicted +1.83%
Consumer Staples Select Sector SPDR Fund: +1.56%
Bitcoin USD: predicted +1.69%
CBOE Volatility Index: +2.35%
Natural Gas Futures: +1.52%
5-Year Treasury Note Futures: +1.55%
AUD/JPY: predicted +1.12%
DXY: predicted +1.17%
USD/CNY: predicted +0.44%
Outcome:
USD/JPY increased 1.08% over 5 days and 3.14% over 10 days, aligning with the positive bias in the forecasts.
Cross-Asset Directional Accuracy
A one-year review of directional accuracy between USD/JPY and other assets highlights how predictability has evolved across time and horizons.
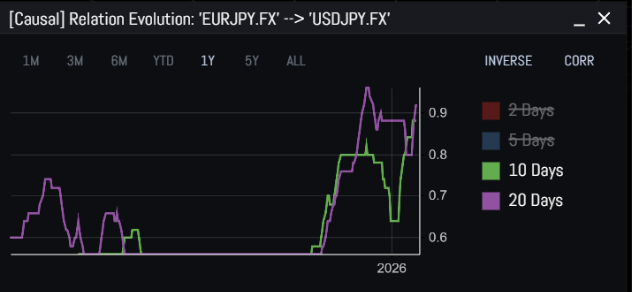
FX Pairs
EUR/JPY → USD/JPY (20-day horizon):
The relationship strengthened materially over time and remained elevated for several weeks rather than reverting immediately.
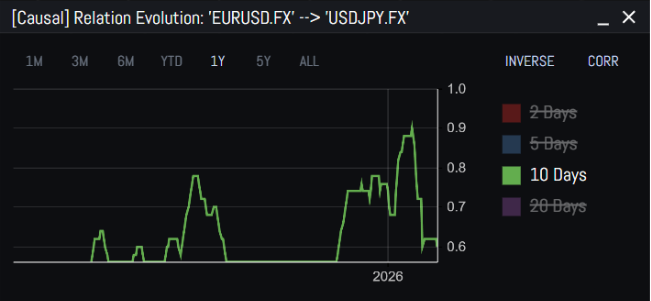
EUR/USD → USD/JPY (10-day horizon)
Equities and Commodities
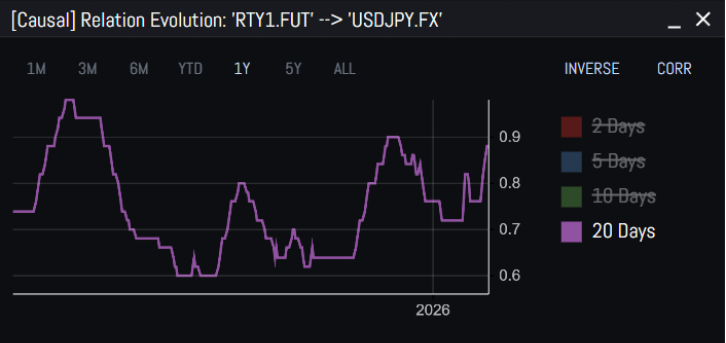
E-mini Russell 2000 Index Futures → USD/JPY (20-day horizon)
The Russell 2000–USD/JPY relationship exhibited repeated cycles of strengthening and weakening alignment over the year.
The February endpoint places the relationship near the upper range of observed accuracy levels, though below prior maxima.
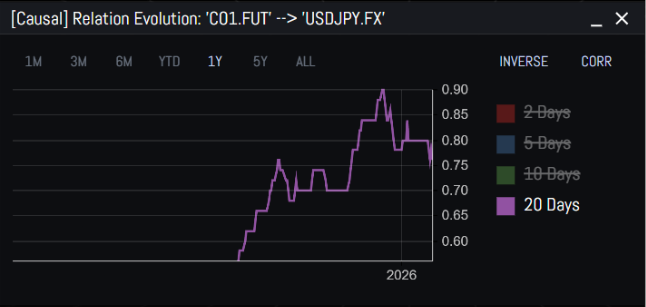
Brent Crude → USD/JPY (20-day horizon):
Accuracy remained materially above zero after peaking, indicating continued directional consistency relative to earlier periods.
Rates and Volatility
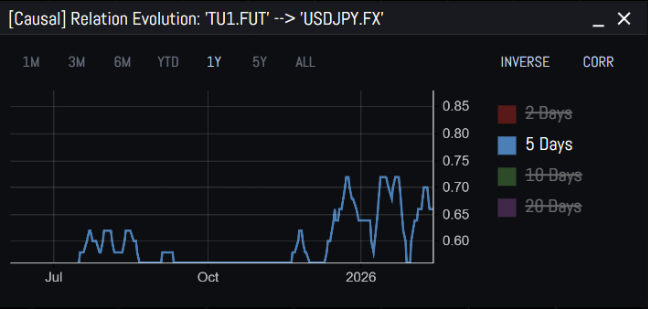
2-Year Treasury Note Futures → USD/JPY (5-day horizon)
The 2-Year Treasury–USD/JPY relationship was variable, with alignment appearing in short episodes rather than persisting continuously.
The February reading reflects a moderate level of directional consistency relative to earlier peaks in the series.
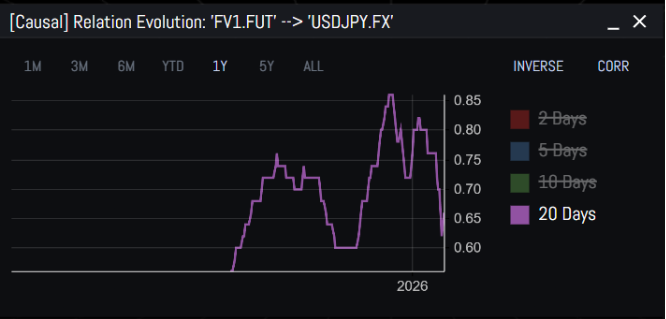
5-Year Treasury Note Futures → USD/JPY (20-day horizon):
The relationship showed wide fluctuations, including both low and high accuracy values within a relatively short time frame.
The decline into late January reflects a reduction in measured alignment, not a disappearance of the relationship
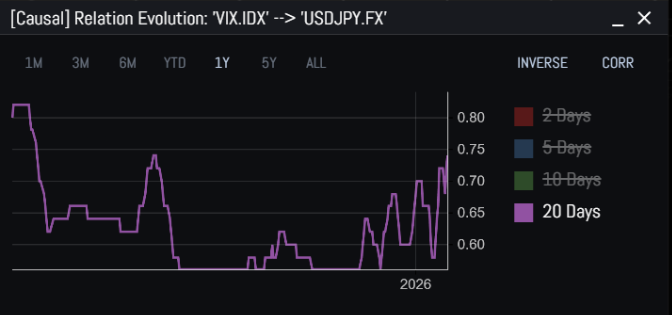
VIX → USD/JPY (20-day horizon):
The VIX–USD/JPY relationship was intermittent, with extended periods of low accuracy interspersed with shorter periods of higher alignment.
The January endpoint represents one of the higher observed accuracy levels within the sample.
Digital Assets
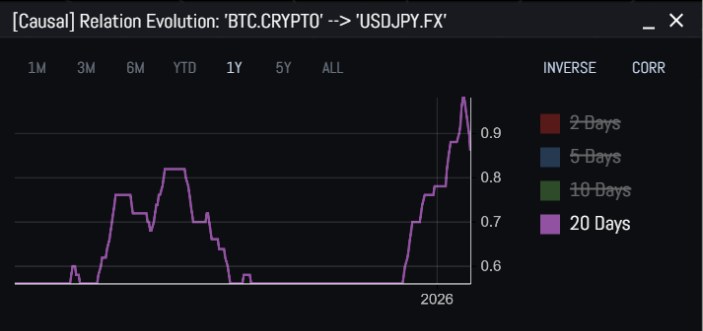
Bitcoin USD → USD/JPY (20-day horizon):
The Bitcoin–USD/JPY relationship experienced a rapid increase to a near-maximum accuracy level, followed by a short-term decline.
Despite the decline, accuracy remained elevated relative to most of the prior year.
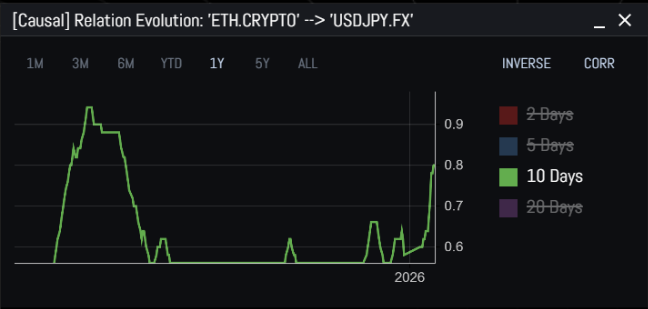
Ethereum USD → USD/JPY (10-day horizon):
The Ethereum–USD/JPY relationship showed high variability, including extended periods of low or zero accuracy and shorter periods of elevated alignment.
The increase into January 2026 represents a renewed period of directional consistency relative to earlier months.
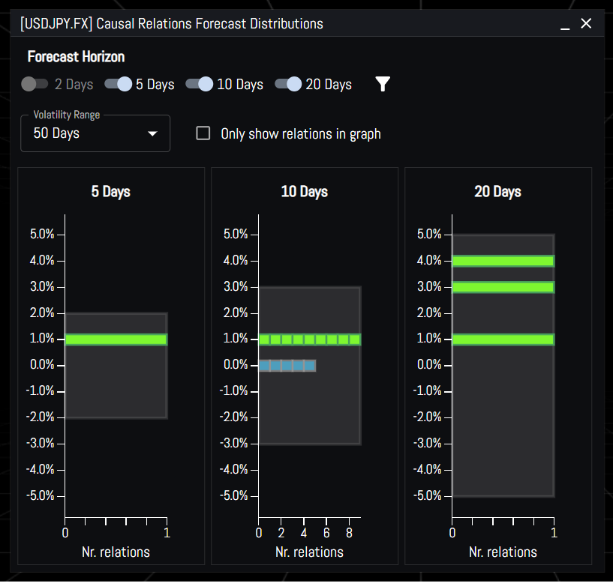
Latest Causal Forecast (from February 13th)
5-10 days:
2-Year Treasury Note Futures predicts +1.17% over 5 days
EUR/USD predicts +0.81% over 10 days
20 days:
IBOVESPA predicts +2.97% over 20 days
E-mini Russell 2000 Index Futures predicts +0.73% over 20 days
Key Takeaways
January 2026 featured two clear inflection points:
Late January decline (–2.08%) following the January 23 forecast.
Early-to-late January recovery (+1.08% over 5 days, +3.14% over 10 days) following the January 28 forecast.
Causal drivers’ effectiveness isn’t stationary.
Short-term price behavior can be inferred through causal networks:
Peaks in directional accuracy are often followed by modest declines, as seen in late January 2026.
These patterns can provide context for interpreting USD/JPY movements through other assets price behavior.
By tracking causal drivers and network effects, we can better forecast USD/JPY price, providing a data-grounded framework for interpretation.
Disclaimer: The information provided in this content is for general informational purposes only and does not constitute investment, financial, legal, tax, or other professional advice. It should not be relied upon as such. Always consult with a qualified professional or advisor before making any investment or financial decisions.